
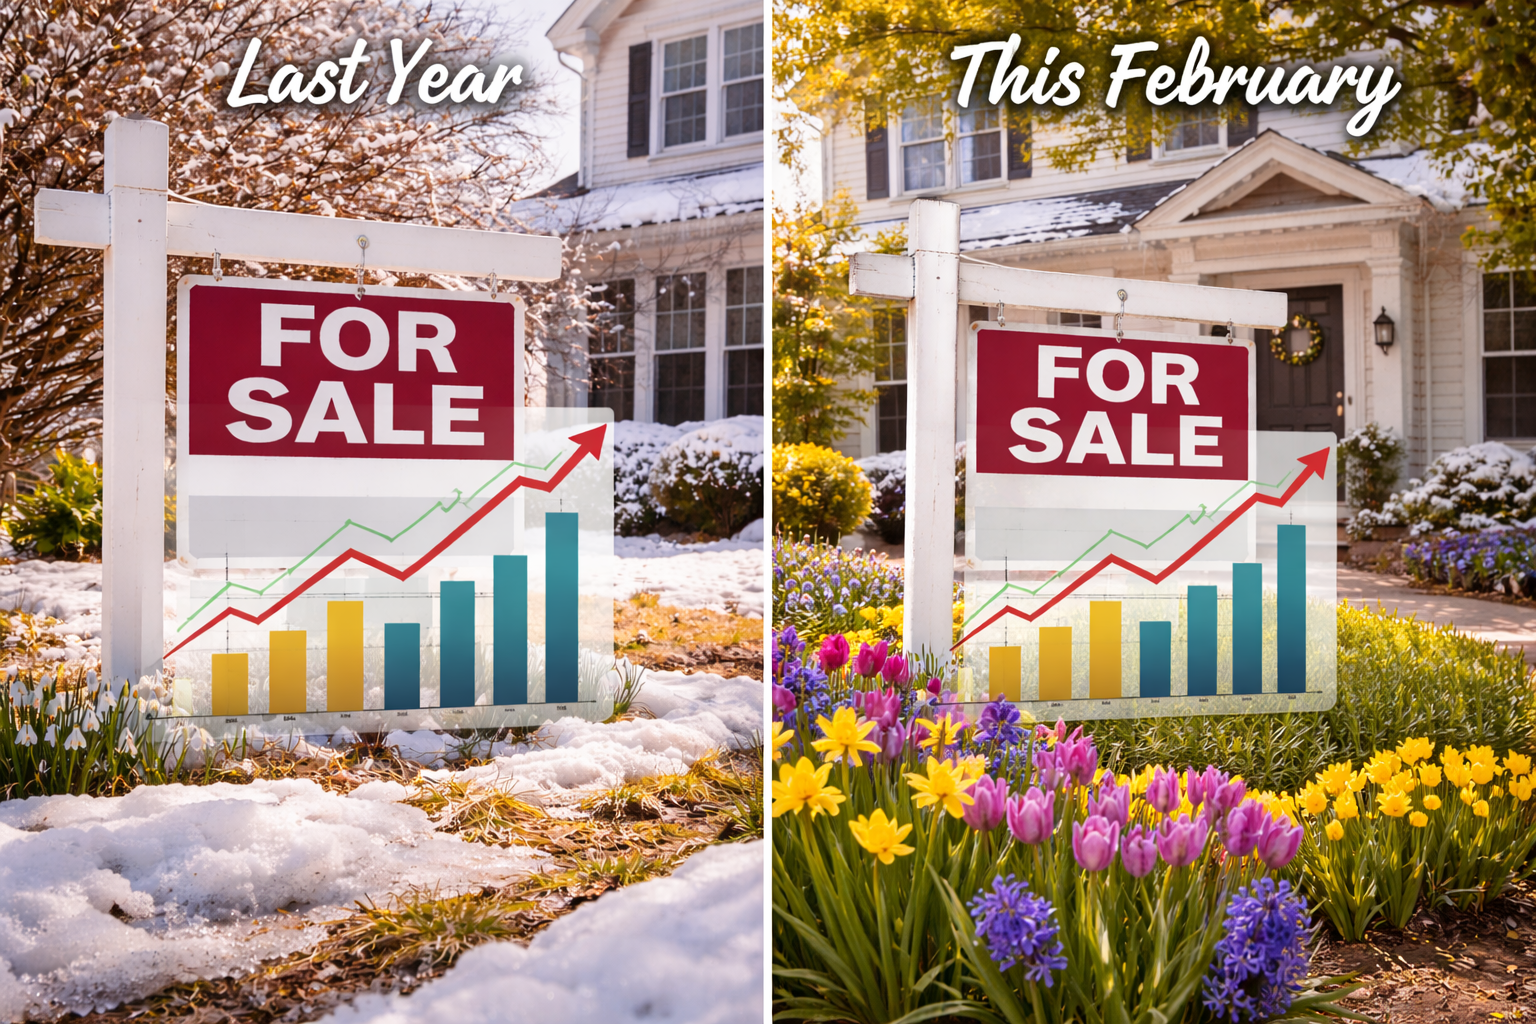
How February 2026 Compares to Last Year in Northern Virginia Real Estate
How February 2026 Compares to Last Year in Northern Virginia Real Estate
Published March 2026 · Jamil Brothers Realty Group · Northern Virginia Market Intelligence
If you've been tracking the Northern Virginia housing market, you already know that 2026 feels different. Buyers have more options. Sellers are pricing more carefully. Mortgage rates have dropped nearly a full percentage point from where they sat a year ago. But how much has actually changed — and what does the shift mean for your next move?
This deep-dive comparison breaks down exactly how February 2026 stacks up against February 2025 across every metric that matters: closed sales, median prices, inventory levels, days on market, mortgage rates, and buyer leverage. We're pulling from the latest NVAR data, Freddie Mac rate surveys, Bright MLS reporting, and the NVAR/George Mason University 2026 Regional Housing Market Forecast to give you the clearest picture possible of where the DMV market stands right now — and where it's heading into spring.
Whether you're a first-time buyer wondering if conditions have improved, a homeowner considering a sale, or an investor evaluating the landscape, the year-over-year data tells a nuanced story. Northern Virginia didn't crash, cool off dramatically, or boom — it recalibrated. And the February numbers are the clearest proof yet.
⚡ Quick Facts at a Glance — February 2026 vs. February 2025
- 30-Year Mortgage Rate: ~5.98% now vs. ~6.76% a year ago (down ~78 basis points)
- Active Listings (Jan 2026): 1,526 units — up 21.1% year over year
- Median Sold Price (Jan 2026): $675,000 — down 1.5% from January 2025
- Closed Sales (Jan 2026): 786 units — down 5.6% year over year
- Days on Market: 42 days avg — up 35.5% from a year ago
- New Pending Sales (Jan 2026): 1,001 units — up 7.3% year over year
- Months of Supply: 1.1 months — up 19.9% from January 2025
- NVAR 2026 Forecast: Moderate price growth, rising inventory, and a more balanced market across all jurisdictions
📑 Table of Contents
- What Does the Year-Over-Year Data Actually Tell Us?
- Why the February Comparison Matters More Than Any Other Month
- Mortgage Rates: The Biggest Year-Over-Year Shift
- Inventory and Days on Market — Then vs. Now
- County-by-County: How Each Jurisdiction Changed
- Pricing: Where Prices Held, Rose, and Softened
- Buyer Leverage and the Negotiation Shift
- Winners and Losers: Who Benefits From the Year-Over-Year Changes
- What to Do Right Now Based on the Data
📊 What Does the Year-Over-Year Data Actually Tell Us?
Comparing February 2026 to February 2025 isn't just a statistical exercise — it's the most reliable way to understand what's really happening beneath the headlines. Year-over-year data filters out seasonal fluctuations and gives us a clear baseline for measuring actual market momentum.
According to the Northern Virginia Association of Realtors (NVAR), January 2026 data — the most recent complete reporting period heading into February — tells a story of intentional recalibration rather than decline. Closed sales fell 5.6% compared to January 2025, while total sold dollar volume dropped 4.6% to approximately $666.1 million. But here's what makes the story more complex: new pending sales actually rose 7.3% year over year, reaching 1,001 units. That means buyer activity is accelerating even as closings lag — a signal that spring 2026 could be significantly busier than the same period last year.
Nationally, the contrast is even sharper. Existing-home sales dropped 8.4% month over month and 4.4% year over year to a seasonally adjusted annual rate of 3.91 million units, according to the National Association of Realtors (NAR). NAR Chief Economist Lawrence Yun noted that severe weather conditions in January complicated the picture, but the broader trend is unmistakable: the national market is moving slowly while Northern Virginia continues to demonstrate stronger underlying demand.
| Metric | Jan/Feb 2025 | Jan/Feb 2026 | YoY Change |
|---|---|---|---|
| Closed Sales (NoVA Region) | 833 units | 786 units | ▼ 5.6% |
| Median Sold Price | $685,000 | $675,000 | ▼ 1.5% |
| Active Listings | ~1,260 units | 1,526 units | ▲ 21.1% |
| Avg Days on Market | ~31 days | 42 days | ▲ 35.5% |
| New Pending Sales | ~933 units | 1,001 units | ▲ 7.3% |
| Months of Supply | ~0.92 months | 1.1 months | ▲ 19.9% |
| 30-Yr Mortgage Rate | ~6.76% | ~5.98% | ▼ 78 bps |
The key takeaway? Northern Virginia's market isn't weakening — it's normalizing. Buyers have more options, sellers must be more strategic, and the combination of lower rates and higher inventory is creating a market that rewards informed decision-making over emotional urgency.
📅 Why the February Comparison Matters More Than Any Other Month
February isn't just another month on the calendar for the DMV housing market. It's the month when the spring market reveals its hand. Inventory that starts building in February typically peaks by late May or early June. Buyer demand that accelerates in February determines how competitive the spring will be. And rate-sensitive activity — like the surge in mortgage applications that occurred when rates briefly dipped below 6% in late January 2026 — shows up most clearly in February's contract data.
For Northern Virginia specifically, February also coincides with critical fiscal and policy signals. Federal budget decisions, government hiring patterns, and defense spending authorizations typically materialize in Q1 — and their effects flow directly into DMV housing demand. In a region where government employment, defense contracting, and tech-sector growth power the economy, these early-year indicators are especially predictive.
💡 Why This Matters: February 2025 was characterized by tight inventory, mortgage rates near 6.9%, and strong seller leverage. February 2026 looks fundamentally different — rates have dropped to the 5.98% range, inventory has jumped over 21%, and buyers are re-entering the market with meaningful negotiating power for the first time in years. The shift between these two Februarys represents one of the most significant year-over-year transitions in Northern Virginia since the post-pandemic rebalancing began.
The NVAR/George Mason University 2026 Regional Housing Market Forecast reinforced this, projecting that the region's market will continue finding balance throughout 2026. NVAR CEO Ryan McLaughlin summarized the outlook by noting that the region's strong employment base, diverse economy, and sustained demand position it well for steady, sustainable growth — not the volatility of prior years.
💰 Mortgage Rates: The Biggest Year-Over-Year Shift
No single factor has changed more dramatically between February 2025 and February 2026 than mortgage rates. According to Freddie Mac's Primary Mortgage Market Survey, the 30-year fixed-rate mortgage averaged 5.98% as of February 26, 2026 — marking the first time in three and a half years that the benchmark rate dropped into the 5% range. One year ago, the same rate sat at 6.76%.
That ~78 basis point decline translates to real money. A buyer financing $500,000 at 5.98% pays approximately $2,993 per month in principal and interest. At 6.76%, that same loan cost roughly $3,253 per month — a difference of about $260 per month, or over $3,100 per year. For households evaluating affordability in Fairfax County or Loudoun County, where median prices approach or exceed $675,000, that monthly savings is significant enough to expand the pool of qualifying buyers.
Freddie Mac Chief Economist Sam Khater noted that this rate milestone, combined with improving housing supply, is poised to bring more buyers into the market as spring approaches. And we're already seeing it in the data: the 7.3% year-over-year increase in new pending sales in Northern Virginia is a direct result of improved affordability drawing sidelined buyers back into the market. If you're considering purchasing and want to understand how today's rates affect your budget, explore your financing options here to see what you qualify for.
💡 Rate Trajectory Context: Rates briefly dipped below 6% in late January 2026, which triggered a 40% surge in refinance applications. Most industry forecasters expect rates to hover in the low 6% range through the first half of 2026, with the possibility of settling into the upper 5% range later in the year if the Federal Reserve delivers additional cuts. Rates below 6% on a sustained basis are possible but not guaranteed.
🏘️ Inventory and Days on Market — Then vs. Now
The inventory story is one of the most consequential year-over-year changes. Active listings in Northern Virginia reached 1,526 units in January 2026 — a 21.1% increase compared to the same month last year. Nationally, inventory rose only 3.4%, meaning Northern Virginia's inventory growth is more than six times the national rate. That regional surge is the clearest indicator that supply constraints in Northern Virginia may finally be easing.
Within that inventory increase, attached housing represents the largest share of current supply. Condominium listings accounted for 725 active units, compared to 579 single-family homes and 222 townhomes. This breakdown matters because it signals that the most affordable segments of the market are seeing the biggest inventory gains — good news for first-time buyers and those looking for alternatives to detached homes in high-cost close-in jurisdictions.
Days on market also shifted meaningfully. The average home in Northern Virginia spent 42 days on market in January 2026, up 35.5% from approximately 31 days a year earlier. That extra time gives buyers a fundamentally different experience than the frenzy of prior years — more time to evaluate, negotiate, and include contingencies like inspections and appraisals. For the first time in roughly five years, buyers are successfully including these protections in their contracts.
One critical nuance that's emerging in early 2026: the market is divided. According to local analysts, buyers are putting newly listed homes under contract at a 3- or 4-to-1 ratio compared to properties that have been sitting for three or more months. More than half of current active inventory in NoVA dates back to November 2025 or earlier. This creates a "two-speed market" where fresh, well-priced listings sell quickly while stale inventory languishes — a dynamic that rewards sellers who list early and price accurately. If you're curious what your home would sell for in this environment, request a home evaluation here to find out.
🗺️ County-by-County: How Each Jurisdiction Changed
Northern Virginia isn't one market — it's a collection of hyperlocal markets, each with distinct pricing dynamics, inventory patterns, and buyer demographics. The year-over-year shifts vary dramatically by jurisdiction, and understanding those differences is essential for making smart decisions in 2026.
| Jurisdiction | Price Forecast (2026) | Sales Forecast | Inventory Change | Key Trend |
|---|---|---|---|---|
| Fairfax County | ▲ 1.9% | ▲ 8.4% | ▲ 35.8% | Stabilizing; more buyer choice |
| Arlington | ▲ 3.8% | ▲ 1.1% | ▲ 27.8% | Premium prices hold strong |
| Alexandria | ▲ 4.2% | ▲ 4.5% | ▲ Moderate | Lifestyle-driven demand persists |
| Loudoun County | ▲ 3.3% | ▲ 7.6% | ▲ 36.2% | Tech + data center demand |
| Prince William | ▼ 0.2% | ▲ 3.0% | ▲ 31.1% | Value market; sales surging |
| Stafford County | ▼ 4.6% | ▼ 2.4% | ▲ 33.3% | Buyer's advantage emerging |
Fairfax County remains the region's largest and most diverse market. Inventory is forecast to jump nearly 36% year over year, but sales are also expected to increase 8.4%, suggesting healthy absorption. The median price for single-family homes is projected to edge up roughly 1.9%. Average home values in Fairfax are hovering around $768,000 according to recent Zillow data, with homes spending more time on market than a year ago. Townhomes and condos are gaining increased buyer attention as more affordable alternatives to detached homes.
Arlington continues commanding the region's highest premiums, with detached homes averaging nearly $1.5 million and the median sale price around $700,000. Prices showed a strong 15.3% year-over-year increase in January, driven by walkability, Metro access, and proximity to D.C. However, sales volume pulled back seasonally, and inventory is up nearly 28%. If you're looking to take advantage of Arlington's premium positioning or explore more accessible neighborhoods, browse current listings across Northern Virginia.
Loudoun County remains one of the most competitive suburban markets in the entire Mid-Atlantic. Data center expansion, strong schools, and the Silver Line corridor continue driving demand, with prices forecast to rise 3.3% and sales up 7.6%. Inventory is surging over 36%, though, which is gradually giving buyers more options even in this high-demand market.
Prince William County delivered the strongest sales performance across the region in January, posting a 17.8% increase in closed sales compared to January 2025. At a median around $540,000–$560,000, the county continues to attract families priced out of Fairfax and Loudoun. New developments in Haymarket, Gainesville, and Woodbridge are bringing new inventory online and attracting government contractors, military families, and first-time buyers.
Stafford County is the one jurisdiction where the NVAR/George Mason forecast projects a notable price decline — down 4.6%. Sales are also expected to dip 2.4% even as inventory grows over 33%. This creates what may be the most buyer-friendly conditions anywhere in the DMV right now.
💲 Pricing: Where Prices Held, Rose, and Softened
The pricing picture across Northern Virginia is more nuanced in February 2026 than at any point in recent memory. The regional median sold price of $675,000 in January 2026 represents a modest 1.5% decline from the same month a year earlier — but that regional number masks wide variation by jurisdiction and property type.
Close-in markets like Arlington and Alexandria are still seeing price appreciation in the 3.8%–4.2% range, powered by structural demand factors that insulate them from broader cooling trends. These are lifestyle-and-transit-driven markets where walkability, Metro access, and proximity to D.C. command persistent premium pricing. Detached homes in Arlington's most desirable neighborhoods have pushed into the $2.5M–$3M+ range, while Alexandria's townhome and condo segments remain active.
Fairfax County — the region's bellwether — is experiencing what analysts describe as a "balanced seller's market." There's enough inventory to give buyers meaningful choice, but not so much that prices face downward pressure. The NVAR forecast calls for 1.9% appreciation, which tracks closely with inflation rather than the double-digit gains of 2021–2022.
The outer counties tell a different story. Prince William's prices are essentially flat (forecast down just 0.2%), and Stafford is the only jurisdiction projecting a meaningful price correction at -4.6%. For buyers who have been priced out of closer-in markets, this creates a genuine entry point — especially with today's lower mortgage rates making monthly payments more manageable.
💡 Key Pricing Insight: The statewide Virginia picture provides additional context. According to Virginia REALTORS®, there were 5,881 home sales statewide in January 2026, outpacing last January by 2.1%. The statewide median was $397,790, essentially flat year over year. Northern Virginia's median of $675,000 remains roughly 70% above the state average — a premium that reflects the region's economic strength but also underscores why affordability remains a challenge, particularly for first-time buyers.
Wondering how these year-over-year pricing changes affect your home's value? Get the data you need to make your next move with confidence.
🤝 Buyer Leverage and the Negotiation Shift
If there's one theme that defines the February 2025 to February 2026 transition, it's the return of buyer leverage. A year ago, buyers in Northern Virginia were competing against multiple offers with limited ability to negotiate on price, terms, or contingencies. Today, the dynamic has measurably shifted.
Months of supply in Northern Virginia reached 1.11 months in January 2026, up 19.9% from January 2025. While that's still well below the four-to-six-month threshold considered "balanced" by traditional measures, the direction is unmistakable. Buyers have more time to evaluate properties, more room to negotiate on price and closing costs, and more ability to include protective contingencies.
This shift is especially pronounced for certain property types and price points. Condominiums — which represent the largest share of active inventory at 725 listings — are experiencing the most buyer-friendly conditions. Sellers in the condo segment who are overpriced or in buildings with high HOA fees are finding that the market has less patience for aspirational pricing than it did 12 months ago.
For single-family homes in high-demand close-in locations, the market remains competitive. Well-priced new listings in Arlington, McLean, Vienna, and parts of Fairfax are still generating multiple offers and selling quickly. But even here, buyers are becoming more selective — preferring fresh listings over homes that have sat for months, and using the extended days on market to negotiate more effectively.
NVAR President Rob Carney summarized the evolving dynamic: with homes staying on the market longer, buyers have more room to evaluate their options, while sellers need to focus on pricing and presentation to capture attention. It's a market where both sides benefit from having experienced representation. If you're ready to explore what's newly listed, see all available Northern Virginia homes for sale.
⚖️ Winners and Losers: Who Benefits From the Year-Over-Year Changes
The shift from February 2025 to February 2026 creates distinct advantages and challenges depending on where you sit in the market. Here's how the year-over-year changes shake out for different groups:
First-Time Buyers — Clear Winners. Lower rates (5.98% vs. 6.76%), more inventory (up 21%), and longer days on market all work in your favor. The monthly savings from the rate drop alone adds meaningful purchasing power. If you've been waiting on the sidelines, this is the most favorable environment you've had in Northern Virginia since at least 2019.
Move-Up Buyers — Positioned Well. You benefit from lower rates on your next purchase, and your current home likely still holds strong equity. The key is pricing your existing home accurately to avoid becoming stale inventory. Homes that are well-maintained and well-priced are still selling efficiently.
Strategic Sellers — Still in a Strong Position. Despite the shift, Northern Virginia is not a buyer's market. Months of supply at 1.1 is still far below balanced levels, and the 7.3% increase in pending sales signals strong buyer activity heading into spring. Sellers who list now — before inventory peaks in May/June — face less competition and can capture early-season demand. The savings from working with a team that lists at 1.5% listing commission become even more impactful in a market where net proceeds matter more than ever.
Overpriced Sellers — Facing Consequences. If your home has been sitting since fall 2025, the data is clear: buyers are passing over stale listings at a 3- or 4-to-1 ratio in favor of fresh inventory. A price adjustment or relisting strategy may be necessary.
Investors — Selective Opportunities. The value markets of Prince William and Stafford County offer the most attractive entry points, particularly in the $500K–$700K townhome range that attracts professional tenants and offers solid appreciation potential. The return of contingencies means investors can perform proper due diligence for the first time in years.
🎯 What to Do Right Now Based on the Data
The year-over-year data points to specific, actionable strategies for every participant in the Northern Virginia housing market:
If You're Buying: Get pre-approved now. With rates near 5.98% and inventory at its highest level in years, February and March offer the advantage of reduced competition before the spring rush fully materializes. Focus on newly listed properties — that's where the best value and fastest movement are occurring. Don't wait for rates to drop further; if they do, you can always refinance. But inventory competition will only increase as spring progresses.
If You're Selling: List early. The data is clear that homes listed in early spring — before the May/June inventory peak — perform better. You'll face fewer competing listings and capture the early wave of motivated buyers who are re-entering the market thanks to improved affordability. Price accurately from day one. The market is punishing overpriced homes with extended time on market, and stale listings are being bypassed at alarming rates. If you need a current assessment of where your home sits, get a professional home evaluation before you list.
If You're an Investor: Look at Prince William County, where sales surged nearly 18% and the median price remains roughly $200,000 below Fairfax County. New developments in Haymarket, Gainesville, and Woodbridge are creating inventory that's well-suited for the rental market. Stafford County's projected 4.6% price decline could present opportunistic entry points for long-term holds.
If You're Watching From the Sidelines: Understand that the market isn't going to crash. Northern Virginia's economic fundamentals — tech sector growth, defense contracting, data center expansion in Loudoun, Amazon HQ2 in Arlington — remain strong. The NVAR forecast calls for moderate price appreciation across most jurisdictions. The question isn't whether to act, but when and how. And right now, the data favors action over waiting.
Whether you're buying, selling, or just evaluating your options, this year-over-year shift rewards preparation and local expertise. Don't rely on national headlines — rely on the data that's specific to your neighborhood, your price point, and your goals. The team that can help you keep up with the smartest way to sell in Northern Virginia is a phone call away.
❓ Frequently Asked Questions
Is the Northern Virginia housing market better for buyers in 2026 compared to 2025?
Yes, conditions have measurably improved for buyers. Mortgage rates dropped from approximately 6.76% to 5.98% year over year, active inventory is up 21.1%, and homes are spending 35.5% longer on market. Buyers have more options, more time to evaluate, and more ability to negotiate than they did in February 2025.
Are home prices dropping in Northern Virginia?
The regional median sold price dipped 1.5% year over year in January 2026, but this varies significantly by jurisdiction. Close-in markets like Arlington and Alexandria are still seeing price increases of 3.8%–4.2%, while outer counties like Prince William and Stafford are flat to slightly declining. Overall, prices are moderating rather than dropping sharply.
What are mortgage rates in Northern Virginia right now?
As of late February 2026, the 30-year fixed-rate mortgage averaged 5.98% according to Freddie Mac — the lowest level in over three years. The 15-year fixed rate averaged 5.44%. Most forecasters expect rates to hover in the low 6% range through the first half of 2026, with the possibility of reaching the upper 5% range later in the year.
How much has inventory increased in Northern Virginia?
Active listings rose 21.1% year over year to 1,526 units in January 2026. This growth rate is more than six times the national inventory increase of 3.4%. Condominiums represent the largest share of current supply, followed by single-family homes and townhomes. By jurisdiction, inventory increases range from roughly 28% in Arlington to over 36% in Fairfax and Loudoun.
Is it a good time to sell a home in Fairfax County?
Fairfax County remains a seller-favorable market despite the shift. Months of supply is still well below balanced levels, and sales volume is forecast to increase 8.4% in 2026. The key is pricing correctly and listing early in the spring cycle. Homes that are priced accurately and presented well are still selling efficiently, while overpriced homes are languishing.
Which Northern Virginia county is the best value for homebuyers right now?
Prince William County offers the strongest value proposition in the region, with a median around $540,000–$560,000 and January closed sales up nearly 18% year over year. Stafford County is also emerging as a buyer-friendly market with projected price declines. Both counties offer newer construction, larger lots, and significantly lower price points than Fairfax or Loudoun.
How has the federal workforce impact affected Northern Virginia housing?
Federal workforce reductions throughout 2025 introduced uncertainty, and NVAR has noted the full impact has not yet been fully realized. However, Northern Virginia's economy has diversified significantly — tech companies like Amazon (HQ2 in Arlington), data center growth in Loudoun County, and defense/cybersecurity sectors have reduced the region's dependence on federal employment. Housing demand has remained resilient despite these headwinds.
Should I wait for mortgage rates to drop further before buying?
Waiting carries risk. While rates may drift lower later in 2026, lower rates will bring more buyers into the market — increasing competition and potentially pushing prices up. Buying now at 5.98% locks in current inventory advantages and lower competition, with the option to refinance if rates drop further. The strategy of "marry the house, date the rate" has never been more relevant.
What does the NVAR 2026 forecast predict for Northern Virginia?
The NVAR/George Mason University 2026 Regional Housing Market Forecast projects continued market balance with moderate price increases across most jurisdictions (1.9%–4.2% depending on location), interest rates hovering around 6%, and higher inventory levels. Sales are expected to increase across most counties, with Fairfax and Loudoun seeing the strongest projected activity growth.
How long are homes staying on the market in Northern Virginia?
The average days on market reached 42 days in January 2026, up 35.5% from approximately 31 days a year ago. However, this average masks a "two-speed market" — newly listed, well-priced homes are still selling quickly, while properties that have been on the market for three or more months are being largely bypassed by buyers. Fresh listings are going under contract at a 3- or 4-to-1 ratio compared to stale inventory.
The Market Has Shifted. Has Your Strategy?
February 2026 looks nothing like February 2025. Whether you're buying, selling, or investing, the Jamil Brothers Realty Group can help you navigate the new landscape with local data, expert strategy, and a commitment to your bottom line. Call us at 703-782-4830.
Categories
Recent Posts


Let's Connect